How to use Autochartist Market Reports with Octa
Autochartist Market Reports provide a clear overview of the current trends across most popular trading instruments. Delivered to your inbox at the beginning of each trading session, the reports can suggest which trade you should enter next or whether your current strategy needs an adjustment. Moreover, it provides significant time saving benefits in analysing the charts.
Each Market Report consists of three main sections:
Each Market Report consists of three main sections:

How to use AutoChartist Market Reports
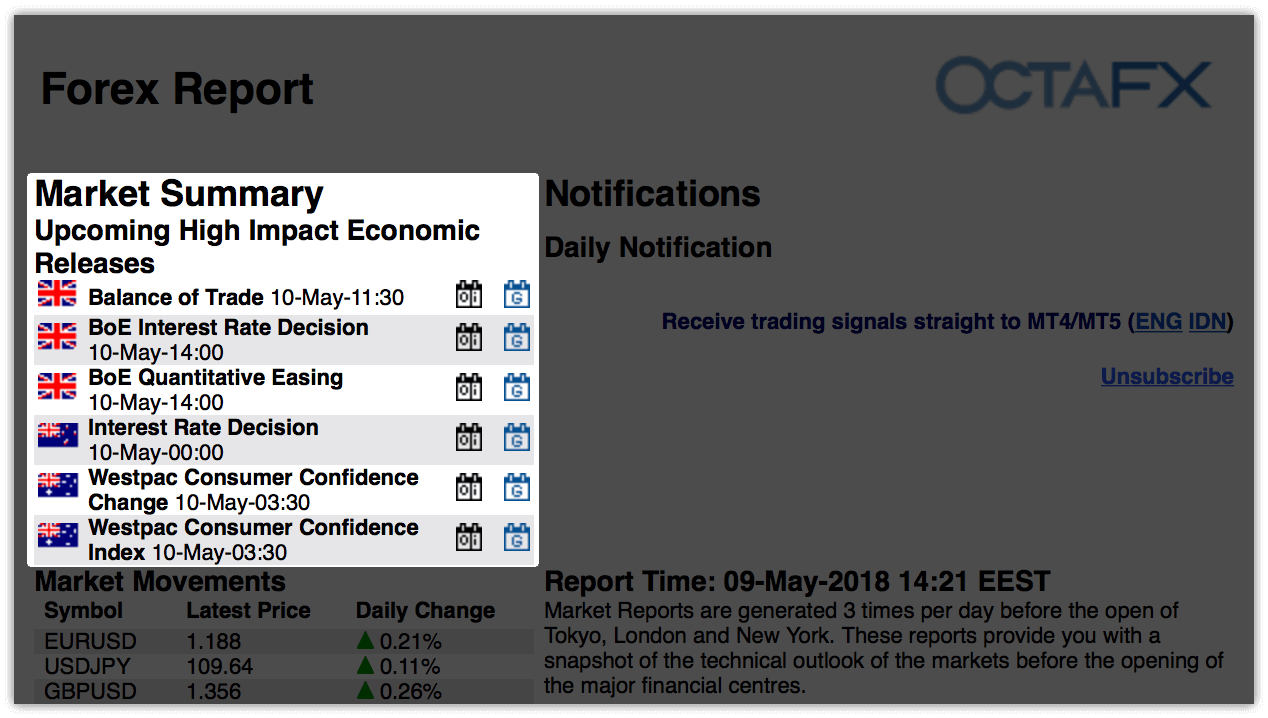
1. Upcoming High Impact Economic Releases
At the top left corner you will find a list of all releases scheduled for the day. These reports are important as it is not uncommon for the market volatility to increase during the major news, therefore risk management techniques may be required in order to lessen risk exposure.
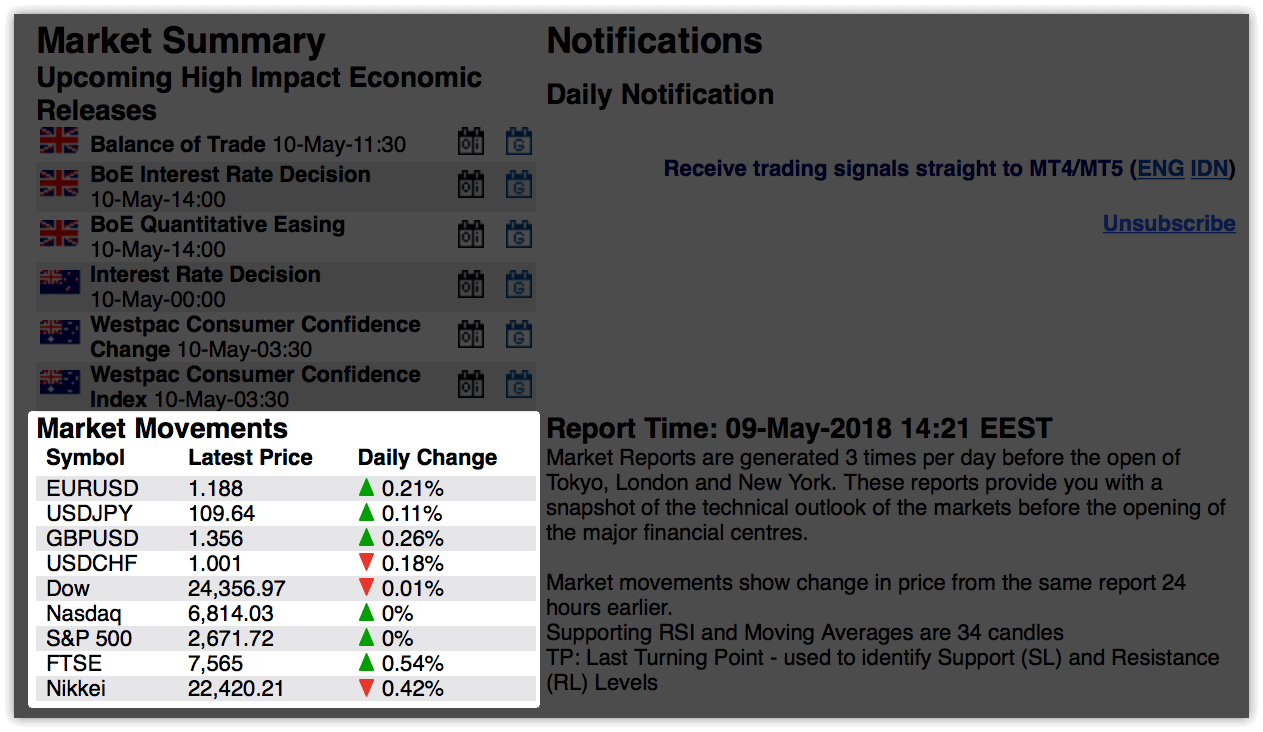
2. Market Movements
The Market Movements section provides an overview of recent price activity for a number of instruments: it shows the direction and the percentage of the price change during the last 24 hours.Daily change percentage is highly correlated with the news and reports - the price may appreciate, depreciate or change its direction completely after an important release.

3. Price Predictions
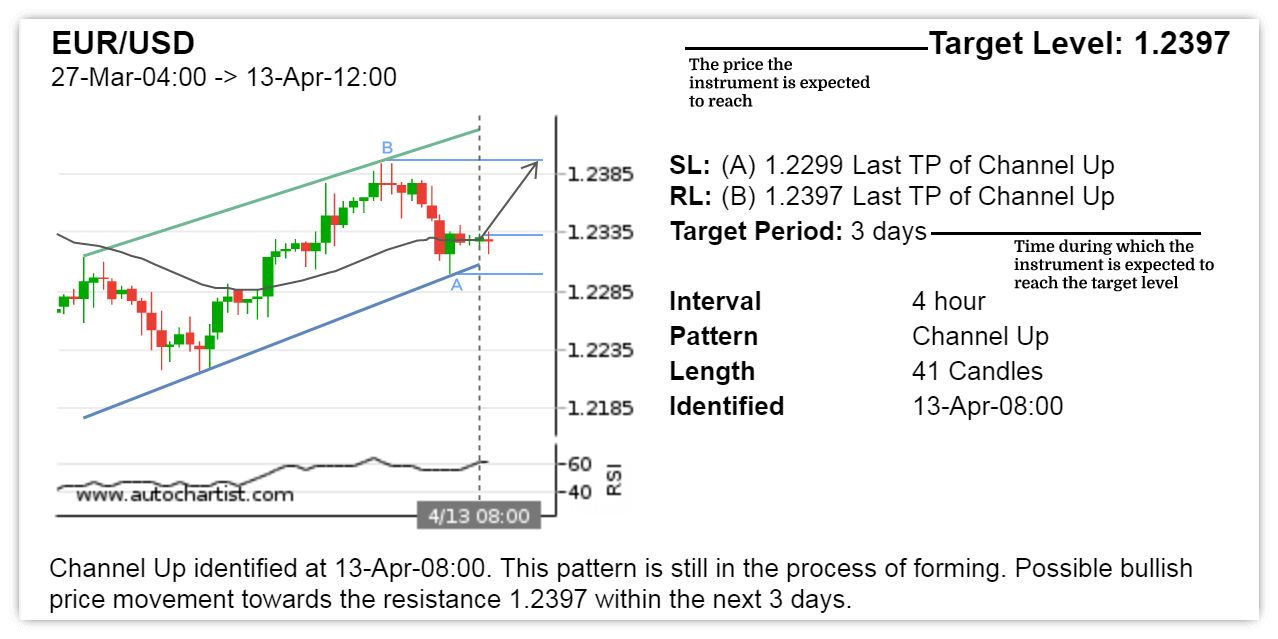
The actual price predictions are right below the Market Movements section. Each of them contains information about the expected price, the time during which the price will be reached, a short breakdown of the underlying indicators, and the name of the pattern.
- SL—Support level
- RL—Resistance level
- Interval—chart periodicity interval the pattern emerged from
- Pattern—the name of the pattern the underlying trading opportunity is based on
- Length—the number of candles the opportunity is based on
- Identified—date and time when the pattern emerged.
In this case the current EURUSD price is 1.23350. Within three days its price is expected to reach 1.23970.
By pursuing this trading opportunity and opening a 1 lot EURUSD long (buy) position, you can potentially gain about 62 pips or 620 USD of profit.
Currently estimated to be up to 80% correct, Autochartist Market Reports are a simple beginner-friendly tool that allows you to apply technical analysis to your trading with no effort or time required.
We provide these for free. Just make sure you reach a Silver user status or higher.
In case you are interested in the Market Reports or signals in general please feel free to contact our Customer Support.
FAQ of Autochartist
What is a trading signal?
A trading signal is a suggestion to buy or sell a certain instrument based on chart analysis. The main idea behind the analysis is that certain recurring patterns serve as an indication of the further price direction.
What is Autochartist?
Autochartist is a powerful market scanning tool offering technical analysis across multiple asset classes. With over a thousand trading signals a month, it allows both novice and professional traders to get significant time-saving benefits by having Autochartist continuously scan the market for fresh, high-quality trading opportunities.
How does Autochartist work?
Autochartist scans the market 24/5 searching for the following patterns:
- Triangles
- Channels and Rectangles
- Wedges
- Head and Shoulders
What is Market Report?
Market Report is a technical analysis based price prediction delivered straight to your inbox up to 3 times a day. It allows you to adjust your trading strategy in the beginning of each trading session depending on where the market is expected to go.
How often are the reports sent out?
Autochartist market reports are sent out 3 time a day, in the beginning of each trading session:
- Asian session - 00:00 EET
- European session - 08:00 EET
- American session - 13:00 EET


